Is Market Opening Window for “Made in U.S.” Revival?
USDA’s seemingly bearish December supply demand report failed to break cotton’s upside momentum. Thus, the 67.50 to 73.50 cent trading ranges continues, with the bulk of the activity in the 70 to 73 cent range.
Despite’s USDA predicted weakness in demand, the market just simply will not let go of either its 70 cent-plus trading or promising demand news outside of USDA’s numbers. USDA ended the week by predicting an increase in both U.S carryover and world carryover for the 2016-17 marketing season. Prices did move lower after the report, down 62 points. Yet, the market fought back and settled the week at 70.80 cents – a moral victory given the big USDA bear.
Mills continue to support the market in spite of negative yarn spinning reports that have a number of Pakistani spinners facing bankruptcy. The problem is more associated with Pakistan than any other country, as yarn prices in China have seen some improvement.
U.S. export sales climbed to a new marketing year high for the week ending December 1, as net sales totaled 409,400 RB (405,200 upland; 4,200 Pima). The most significant sale was to Japan. While it was only 58,500 RB, compared to 103,200 RB purchased by Vietnam and 74,600 RB by Turkey, the fact that Japanese purchases were so large at this time of the year is suggestive that Japanese yarn spinners feel prices will rise. Too, China remained a large scale buyer taking 60,800 RB.
Export shipments also improved significantly, as shipments climbed to a marketing year high of 237,700 RB (229,700 Upland and 8,000 Pima). Export sales to date total 4.7 million bales, compared to 3.0 million bales at the same time a year ago. Shipments total 3.0 million bales versus a comparison of 1.9 million bales year ago. Thus, sales are on pace to be a million bales or larger than the current USDA export estimate of 12.2 million bales. The pace of actual shipments is also ahead of the pace needed to meet the current USDA estimate.
Thus, look for USDA to continue to increase its estimate of the demand for U. S. cotton. Too, the high quality of the 2017 U.S. crop is finding unusually strong demand from international mills.
The demand side of the price equation received an additional boost, as mills are not fully covered for the first quarter of 2017 and are poorly covered for the second quarter. Brazil, Australian and U.S. merchants are all active looking for high grades to fill needs.
While the U.S. has sufficient quantity of cotton at the present time, the Southern Hemisphere faces a different picture. Merchants are pressed to find quantity, and the Australian 2016-17 crop is just emerging. Australian plantings have noted a significant jump, as some 520,000 hectares were planted compared to only 312,000 last year. This is the largest Australian planted area since 2011-12 plantings of 655,000 hectares.
USDA increased its estimate of the 2016 U.S. crop to 16.5 million bales, up 300,000 in the December supply demand report. Additionally, domestic mill use was cut 200,000 bales and lowered to 3.3 million, down from the prior estimate of 3.5 million. The estimate for exports was raised 200,000 bales as USDA typically does when it increases crop size and was 12.2 million. Thus, ending stocks for July 31, 2017 were estimated to increase 300,000 bales and are now estimated at 4.8 million.
The world crop was estimated at 104 million bales, up 1.0 million from the November estimate. World consumption and exports were essentially unchanged. Thus, world carryover was increased the same 1.0 million bales, up to 89 million. Imports of cotton to India, notably 1.0 million bales in August and September, suggest the USDA continues to carry its estimate of Indian stocks some 3.0 to 4.0 million bales too high. Nevertheless, world stocks still exceed 85 million bales.
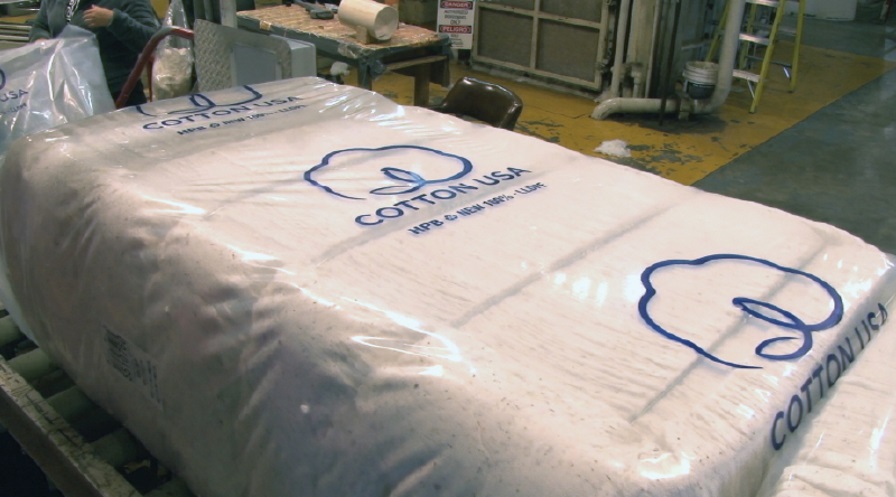
U.S. cotton is attempting to revive its “Made in U.S.” theme. As difficult as the road to that revival seems, U.S. and world cotton continues to battle for fiber market share. To date, the battles have been won overwhelmingly by the acid-based chemical industry located in China. Yet, prices for polyester have seen a significant rise. Most of the world’s acid-based chemical fibers are manufactured in China. Since October 1, polyester prices have increased 15%. Since November 1, prices are up 10% (December-RMB 7,810 per ton; November-RMB 7,135 RMB per ton; October-6,790 per ton).
Thus, cotton has been presented a small window to slow the decline in consumer preference. Nevertheless, the battle ground remains unfavorable unless cotton can regain consumer confidence. Consider the following: the price of acid-based fiber on December 8 was the equivalent of 51.65 cents per pound. This was the highest price quoted for the chemical fiber since June 2015. Viscose fiber price was 100.2 cents per pound, and Chinese cotton was quoted at 105.2 cents per pound (T-328).
Nevertheless, cotton prices continue very range bound and should continue, but with a slight upward bias as speculative funds now have their largest positions of all time. If funds continue to hold, then the upward bias will hold, as mills have dug their heels in and are showing a willingness to pay up.
Give a gift of cotton today.


