


Precision and Agricultural Technology Adoption Trends in Cotton


One of Cotton Incorporated’s missions is to improve cotton production profitability through research. To make sure our research direction is addressing current challenges, and that past research results have had a positive impact, Natural Resource Surveys of U.S. cotton producers were conducted in 2008, 2015, and 2023. These data are also used to tell cotton farmers’ sustainability story and document continuous improvement in the industry, in part by providing data for life cycle assessments. This article focuses on only questions related to precision agricultural technology adoption.
Farmers in every cotton-producing state participated in the surveys, and the proportion of responses generally matched acres grown in the state (e.g., Texas, with the highest number of planted cotton acres, had the highest number of responses, followed by Georgia, which has the second most planted acres). In all surveys, the respondents represented at least 9% of acres planted in the year of the survey. Note that region is sometimes referred to in these results, and they are defined as: Far West: CA, AZ, NM; Southwest: TX, OK, KS; Mid-South: MO, AR, MS, LA, TN; and Southeast: AL, FL, SC, NC, VA.
Trending Technologies
A common question across all surveys was for growers to rank 29 possible production concerns as major, moderate, or not an issue. The number one concern across all three surveys was cotton production costs, and as growers cannot control input costs, precision technologies are one of the primary tools to make sure they only apply what is needed so no money is wasted.
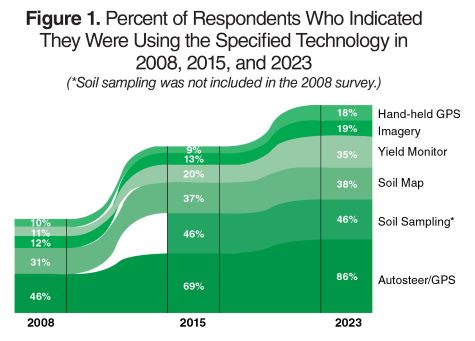
Therefore, as expected, there has been an upward trend in the adoption of various technologies, except for soil sampling, which has remained steady at 46% as shown in Figure 1. Only 4% of all respondents reported not using precision technologies in the 2023 survey. Note that the soil mapping and soil sampling are in reference to use of the samples to address within field spatial variability, not soil sampling in general. For determination of fertility rates, 77% of respondents indicated they use soil test recommendations.
Use of autosteer technology has experienced a significant increase, surging from 46% in 2008 to 69% in 2015 and further to 86% in 2023. The trends in autosteer and yield monitor adoption are also consistent with an independent survey conducted by the USDA Economic Research Service on precision agriculture adoption on U.S. farms for multiple commodities that included cotton in 2000, 2003, 2007, and 2019.
In both studies, adoption rates for yield monitors and autosteer increased, but autosteer adoption was much higher than yield monitors. As seen in Figure 1, the increase in autosteer outpaced all the other technologies and practices considered. It is speculated that autosteer is a technology that is now becoming standard on new equipment and requires only minimal preparation to use relative to the other technologies where maps need to be downloaded, interpreted, transformed into application rate maps, and reuploaded.
Autosteer reduces operator stress and can improve input use efficiency by eliminating skips and over application due to overlaps. It is anticipated that the increased use of wireless modems in agricultural equipment will ultimately increase the use of other technologies when memory cards no longer must be carried from the office to the equipment.
In addition, new data analysis techniques are automating interpretation of soil and yield maps. Agricultural data science consultants are also becoming available to help farmers get the most value from their data.
There is evidence that increased ease of use and factory-installed options will facilitate future tech-nology adoptions by considering the regional adoption of yield monitors in Figure 2. Yield monitor adoption levels in 2015 were correlated with round module use reported in a cost of ginning survey for 2016 (Valco, T.D., H. Ashley, D. Findley, J. Green, R. Isom, T. Price. The Cost of Ginning Cotton – 2016 Survey Results. 2018 Beltwide Cotton Conferences, San Antonio, TX, January 3-5, 2018. National Cotton Council, Memphis, TN. Pp. 528-53).
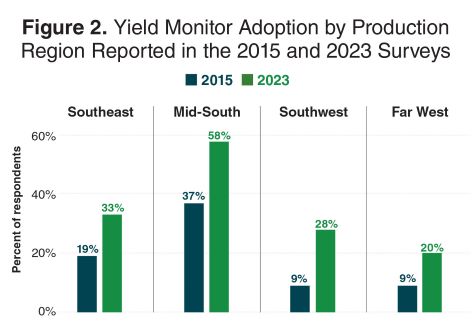
In the costs of ginning survey, round module use was reported as 51% in the Southeast, 61% in the Mid-South, 36% in the Southwest, and 29% in the Far West, which matches the rankings of yield monitor adoption in Figure 2.
According to survey respondents, the adoption of yield monitor technologies increased across all four regions. As yield monitors only became a factory installed option when module building harvesters were introduced. It is expected that the increased implementation of data collecting technologies on agricultural equipment will lead to future increases in technology adoption.
The next evolution of precision technologies is likely to be influenced by advances in automation technologies. Automation, including the integration of driverless tractor technology, may significantly enhance operational efficiency and precision in agricultural practices by streamlining tasks such as planting, spraying, and harvesting.
The 2023 survey introduced some new questions to cotton farmers regarding the benefits and impediments of using driverless tractors on their farms. More than 50% of respondents reported labor savings as one of the expected benefits of driverless tractors, 41% cited improved efficiency, 28% highlighted decreased worker exposure, and 34% considered the technology to have no benefits. It is likely that growers who have already invested in large swath equipment (e.g., sprayers with 120-foot booms) would see minimal benefits from eliminating an operator from such a machine.
Research is in process to see if more benefits from automation could be achieved by decreasing equipment size, making it more scalable to the task and field size. Additionally, having a few to several smaller pieces of equipment reduces downtime risk, as when a large piece of equipment fails, production on hundreds of acres a day is lost. The scale of equipment will likely be a balance between the number of units that have to be managed, the task to be completed, and average field sizes and shapes on the farm.
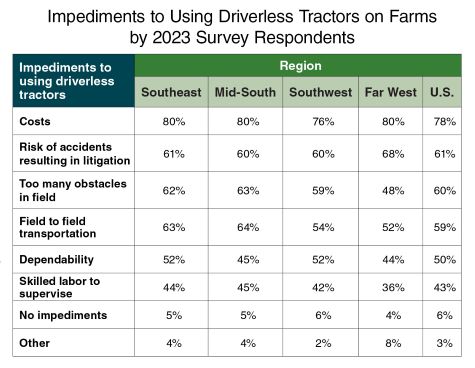
Impediments to Driverless Tractors
For the most part, responses were very consistent across regions with the exceptions of field obstacles and field-to-field transportation concerns. The increased concern in the Southeast and Mid-South is likely reflective of the increased number of water features and topography changes that impact fields in those regions relative to the Southwest and Far West. Across all regions, there is consensus that costs of the technology could be an impediment to its use on their farm.
A question was also asked about the practices identified as high priority for automation. Respondents indicated that planting (40%), spray applications (40%), harvest (35%), and pre-plant weed control (35%) were priorities. We are early in the transition to automated agricultural equipment, so it will be interesting to see how these opportunities evolve in the next five years. The number of systems either available or soon to be available for spot spraying of weeds using machine vision is one indicator of how fast these technologies are reaching the turnrow.
In Summary
The 2023 survey results show a consistent trend in increased technology use by cotton farmers. New innovations that will make various technologies easier to use in the future should enable the trend to continue. The concerns around the costs of driverless tractors serve as a reminder that any new technology must provide a positive return on investment. As these technologies continue to evolve and become more accessible, they are expected to play an important role in addressing the major concerns of cotton producers, particularly in terms of production costs and efficiency.
This is the first public release of information from the 2023 survey, and a full report of all the results will be released later this year. Special thanks to all the cotton farmers who participated in this survey.