


Shurley on Cotton: Where Did the Acres Go?
 July 6, 2017
 The June 30 USDA Planted Acreage report did not deliver as expected. The market (December futures) initially reacted upward, but seemingly has now re-established its pre-report bearish tone. These are cautious and confusing times for producers who seek to manage risk in this topsy-turvy market.
I may be wrong, but I believe the general consensus was that the Acreage report, for a number of reasons, would show actual cotton acres planted to be higher than shown in the Planting Intentions report back in March. Well, by now you probably know that was not the case.
Compared to planting intentions, actual acres planted are equal to or higher in 14 of 17 states. The three exceptions are Arkansas, Texas and Virginia. Overall, 2017 acreage is estimated to be 19.7% more than last year, but 178,000 acres less than what was reported as planting intentions back in March.
This 178,000 acres may not seem like much. But when you consider that most analysts were expecting an increase in acres compared to the March number, then U.S. cotton acres are easily 500,000 acres less than what was expected. THAT is not an insignificant number.
Of the numbers shown here, I want to focus a little bit on Texas and Georgia. Texas, because it’s, well, Texas. And Georgia because of other issues of interest related to cotton acreage.
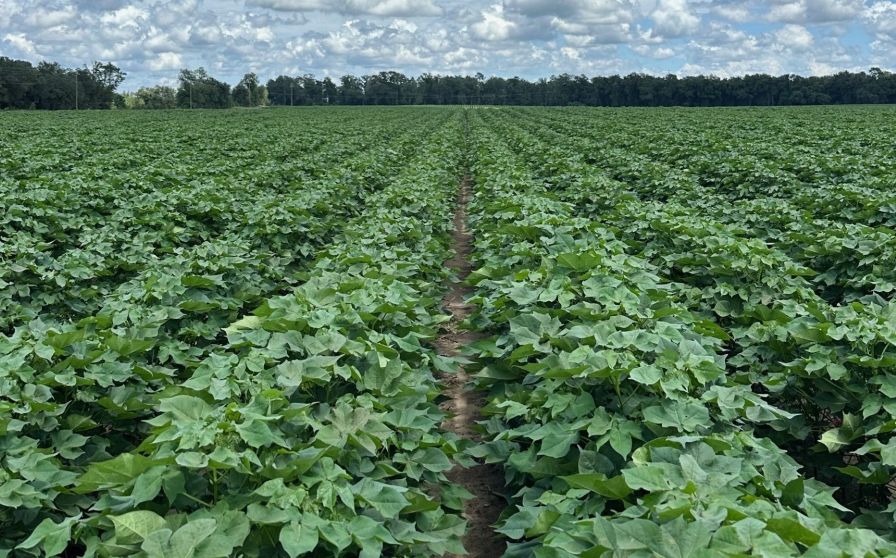
Even with the lower actual acreage number, Texas still figures to plant 16.8% more than last year. Information coming out of Texas seems to suggest the crop right now is a real “mish-mash.” It depends on where you are, when you got planted, the timing and impact of rain or the lack thereof since planting, and the impact of more recent rain and storms. Some acreage has been replanted, some not. Rain has helped in some situations, but wind and hail damage are also reported.
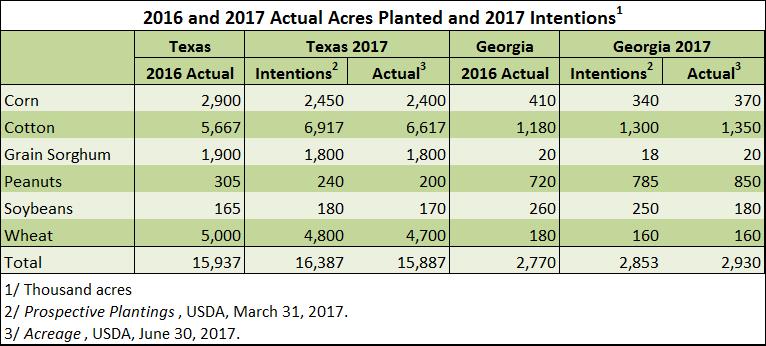
Looking at some of the crops in Texas, actual acres planted was less than planting intentions for five of the six crops. Simply on the basis of these numbers, there appears to have been no shift from cotton to other crops. It could be that the March intentions number was just high, or it could be that “statistically” there’s no difference between the two – that both are within the sampling error confidence interval of the other.
In Georgia, cotton acreage is projected to be 1.35 million acres – 50,000 acres higher than the March estimate and 170,000 acres higher than last year. This is not unexpected. Acres planted in the Southeast (AL, FL, GA, NC, SC, VA) is estimated at 2.565 million acres – 100,000 acres higher than intentions and 394,000 acres more than last year.
In Georgia, peanut acreage planted is estimated at 850,000 acres – 65,000 acres more than intentions and 130,000 more than last year. If realized, this would be the highest acreage since 1991 and also 65,000 more than in 2015 – the first full crop year under the new farm bill with its “temporary base” for covered commodities planted and assigned to Generic Base.
Cotton and peanuts are the only major row crops in Georgia with increased plantings this year. With increased peanuts, concerns rise about shorter crop rotation. But note that total acres planted to these six crops is up 160,000 acres from last year. Additional land brought into row crops or from other crops is not shown.
The Planting Intentions report is based on a survey conducted late February through mid-March. The Acreage report is based on a survey conducted early to mid-June. During the period for the March survey, cotton prices were on the increase and mostly 74 to 75 cents. Prices then declined but rallied back during April and were mostly 72 to 75 cents during planting time. Prices did not fall off the cliff (below 72 cents) until after most of the crop would have been planted and too late to replant or plant to another crop.
Prices were in a downtrend during May and mostly 72 to 73 cents during the Acreage survey period. But this is not likely enough to sway acreage, and, as mentioned, no increase to other crops is reflected in the table.
As far as the outlook is concerned, it looks like prices are trying to stabilize around 67 cents. I think last week’s numbers now add even more uncertainty to the overall situation. Weekly crop condition reports, especially from Texas, will be looked at closely.
The July crop production and supply and demand estimates come out on July 12. The July numbers will use the new acres planted number of 12.055 million, but the estimate of acres to be harvested and yield will still be based on historical average but adjusted to reflect current conditions in the Southwest. The August report will be the first to provide survey-based estimates of acres planted, to be harvested, and yield.
The present and ongoing agronomic uncertainty could provide support for the market and even provide some good reasons for improved prices as we proceed. The present uncertainty could help solidify support in the 67 to 68 cent area until the August numbers come out. The August numbers will then either confirm/support where the market is at the time or send us higher or lower.