


NCC Projects 11 Million U.S. Cotton Acres in 2017
 February 11, 2017
 The National Cotton Council (NCC) Annual Planting Intentions survey projects 11.0 million acres of cotton to be planted in the U.S. in 2017.
Upland cotton acres are projected at 10.75 million acres, with Pima/ELS cotton anticipated on another 266,000 acres.
The survey results were presented as part of the 2017 Cotton Economic Outlook during the NCC’s 79th Annual Meeting in Dallas, TX. The projected total is in line with Cotton Grower’s January acreage projection of 10.89 million acres.
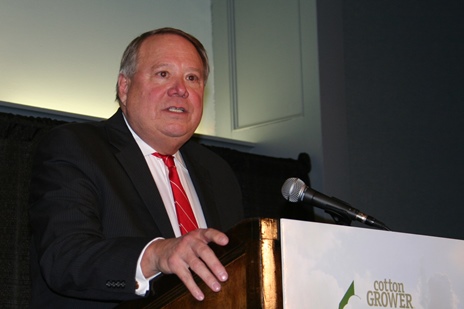
In her analysis of the survey results, Dr. Jody Campiche, NCC vice president, Economics & Policy Analysis, said the total 2017 acreage projection represents a 9.4% increase over 2016.
“With abandonment assumed at 12% for the United States, projected Cotton Belt harvested area totals 9.7 million acres,” explained Campiche. “Using an average U.S. yield per harvested acre of 830 pounds generates a cotton crop of 16.8 million bales, with 16.0 million upland bales and 760,000 extra-long staple bales.


“However, it is important to note that the increase in cotton acreage is largely the result of weaker prices of competing crops and improved expectations for water.”
For upland cotton, acres in the Southeast are expected to total 2.2 million acres – an increase of only 0.1%. Positive gains are projected in Alabama (14.2%) and Florida (5.4%), while acreage in Georgia, North Carolina, South Carolina and Virginia is expected to decrease slightly.
Mid-South upland acres are projected to increase 12.8% to 1.7 million acres. All states in the region show acreage increases, led by Mississippi (26.8%) and Tennessee (16.6%).
Southwest upland acres show a 10.7% increase to 6.6 million acres, based on percentage increases in Kansas (42.0%), Oklahoma (30.1%) and Texas (9.5%).
Upland acres in the Western states are projected to grow 15.1% to 268,000 acres, largely due to a 28.3% increase in Arizona and a 4.5% increase in New Mexico. California upland acres are projected to decrease by 1.5%.
For ELS cotton, the projected total of 266,000 acres represents a 36.9% increase over 2016. Acreage increases are expected in Arizona (79.6%), California (31.4%) and Texas (68.4%), with New Mexico acreage holding steady.
The NCC distributed its annual survey in mid-December, asking respondents for information for 2016 plantings of cotton, corn, soybeans, wheat and other crops, as well as intended acreage for 2017.
“As always, the survey results should be viewed as a measure of grower intentions prevailing at the time the survey was conducted,” pointed out Campiche. “Changing climate and market conditions could cause actual plantings to be significantly different from stated intentions.”
Additional details of the entire 2017 Cotton Economic Outlook are now online.
PROSPECTIVE 2017 U.S. COTTON AREA
2016 Actual (Thou.) 1/ 2017 Intended (Thou.) 2/ % Change
SOUTHEAST 2,170 2,173 0.1%
AL 345 394 14.2%
FL 102 108 5.4%
GA 1,180 1,144 -3.1%
NC 280 267 -4.8%
SC 190 189 -0.4%
VA 73 72 -1.0%
MID-SOUTH 1,490 1,680 12.8%
AR 380 389 2.5%
LA 140 153 9.5%
MS 435 552 26.8%
MO 280 289 3.1%
TN 255 297 16.6%
SOUTHWEST 5,987 6,630 10.7%
KS 32 45 42.0%
OK 305 397 30.1%
TX 5,650 6,187 9.5%
WEST 233 268 15.1%
AZ 120 154 28.3%
CA 66 65 -1.5%
NM 47 49 4.5%
TOTAL UPLAND 9,880 10,751 8.8%
TOTAL ELS 195 266 36.9%
AZ 15 26 79.6%
CA 155 204 31.4%
NM 8 8 -0.8%
TX 17 29 68.4%
ALL COTTON 10,075 11,017 9.4%
1/ USDA-NAS 2/ National Cotton Council