


Shurley on Cotton: No Valentines for Cotton
 February 16, 2016
 By Dr. Don Shurley
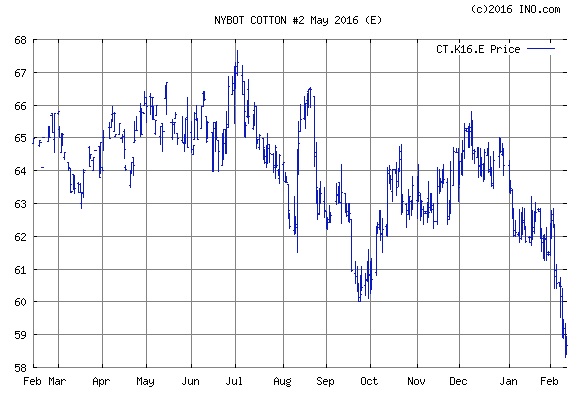
February has thus far been a brutal month for cotton prices.
Old crop May 2016 futures prices have lost four cents per pound, and new crop December 2016 futures have lost over 3½ cents. This represents a 6% loss in value just within the past 10 days or so. Both old crop and new crop futures prices have fallen below 60 cents – a level not thought very likely, but what support the cotton market had around 61 cents could not hold.
When USDA released its February monthly production and supply/demand estimates, the numbers were not pretty. That report isn’t the only thing hammering cotton right now, but it sure didn’t help and added to the already bearish outlook for cotton.
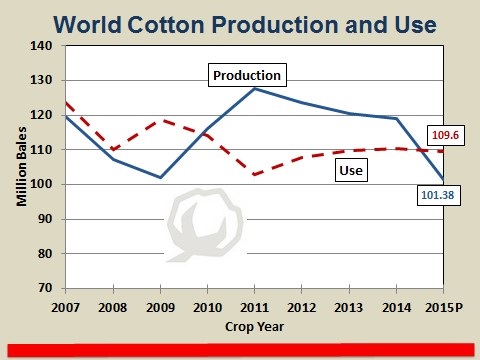
USDA’s February numbers trimmed World cotton demand for the 2015 crop year by another 1.3 million bales. The mill use estimate for China was reduced by 500,000 bales from the January estimate, India was lowered 500,000 bales, and Pakistan lowered by 200,000 bales. World use, or demand, for cotton now stands below 110 million bales and has been flat since 2012.


China’s cotton imports for the 2015 crop year were lowered by 500,000 bales, and China – once the World’s largest cotton importer – now ranks third behind Bangladesh and Vietnam. This is significant, because the U.S. is the World’s largest cotton exporter and China has always been our number one buyer. U.S. cotton exports for the 2015 crop year were lowered by 500,000 bales and are now expected to be 1.75 million bales less than for the 2014 crop year.
With demand struggling and increasing uncertainty surrounding China (its stocks, its mill use, and its policies) and the changing roles among all the players in the cotton game, the future of U.S. cotton may depend on cultivating trade with these new players and continuing to find ways to recover market share lost to manmade fibers. Over the next few months, as planting season approaches, we’ll hear a lot about acres and the weather. That’s fine. But cotton’s long-term future is all about demand.
The recent sharp decline in prices means the Market Loan Gain (MLG) and merchant equities will increase, assuming no other changes such as basis and fiber quality price differentials. In other words, the Loan and inverse relationship between prices and the LDP/MLG acts to help insulate the grower from low prices. When prices go down, the LDP/MLG will increase.
The folks hurt the most by this most recent decline are those that took the LDP earlier, thus bypassing the Loan, but who still are holding cotton.
On February 5, the National Cotton Council released its survey-based estimate of the cotton acreage U.S. farmers intend to plant this year. That number is 9.1 million acres – up a little over 500,000 acres or 6.2% from last year. This is right in line with what most analysts and observers thought it would be.
What was surprising, however, is where the 9.1 million acres is expected to come from – or not come from. The survey suggests that Georgia will be down 5% from last year. I believe this is unlikely unless peanuts acres remain very high, as last year. Even if peanut acreage does remain high (and there’s a good probability that it could), I would expect cotton to gain a little ground from corn and soybeans.
Cotton acreage in the Mid-South is expected to increase almost 25%. An increase here was expected. Although cotton and all crop prices are down from a year ago, at the time the Council survey was taken, corn and soybean prices were weaker relative to cotton. This would likely result in a shift of acres back to cotton, and that’s what the Council’s numbers suggest.
Actually, however, given the recent slide in cotton prices, cotton, corn and soybean prices appear to be in a similar relationship to last season at this same time.
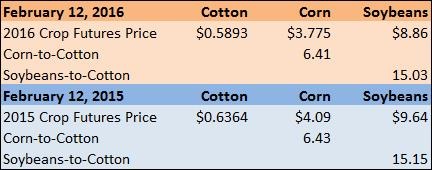
One must also be cautious when using such ratios as a possible indicator of acreage decisions. This does not include consideration of LDP/MLG on cotton, fiber quality differences on cotton, and does not consider any possible ARC/PLC payments for corn and soybeans planted on Generic Base.
The Council’s survey also suggests that Texas is expected to be up 267,000 acres from last year. This is considerably lower than what was expected. Acreage in Texas was expected to increase by 500,000 acres or more. Last year, Texas farmers would have planted at least 500,000 acres more than they did had weather cooperated. For many Texas growers, there are few, if any, reasonable alternatives to cotton regardless of prices.
Acres harvested and yields are more important price drivers than acres planted. So, regardless of how plantings work out, Mother Nature will ultimately be a key factor in determining 2016 prices.
It is already being suggested that actual cotton planted will be less than the Council’s 9.1 million acres figure. USDA’s first estimate will be out on March 31. Just because prices have taken a tumble does not mean acres will decline. Growers know that LDPs are available when prices are low – the market isn’t the only signal out there. As we near planting time, relative prices, expected LDPs, and expected ARC/PLC payments on Generic Base will determine which way acres go.
Shurley is Professor Emeritus of Cotton Economics, Department of Agricultural and Applied Economics, University of Georgia