


Shurley: Connecting the Dots with Old Crop and New Crop
 February 19, 2023
 Prices. Old crop March futures remain in the now 3-month-old range of mostly 80 to 88 cents. Prices recently seem to have settled or diverged to 85 to 86 cents. Such a fairly long-standing parallel movement often demonstrates that downside risk is limited, but so is upside potential.
So, this creates a tough decision for producers holding remaining old crop yet to sell. Depending on basis and fiber quality, Southeast producers, for example, can currently reach close to 90 cents.
USDA February Numbers. USDA’s monthly supply and demand estimates for February were released on Feb. 8. The numbers weren’t earth shattering but were neutral to supportive for the market:
- The 2022 U.S. crop was unchanged from the January estimate.
- U.S. exports for the 2022 crop marketing year were also unchanged.
- U.S. domestic use was reduced 100,000 bales.
- 2022 world production lowered 1.03 million bales; reductions for India and African countries; increases in China and Pakistan.
- World use/demand was lowered 190,000 bales – over half of that accounted for by the cut in the U.S. A positive and encouraging sign: use for China was increased 500,000 bales.
- World ending stocks were reduced 850,000 bales.
U.S. carry-in stocks going into the 2023 crop year on Aug. 1 were raised 100,000 bales – not much in the grand scheme of things, but every bale of carry-in is mathematically less crop needed in 2023.
Exports. Weekly export reports are watched closely and considered one barometer of how demand is doing. U.S. export shipments for the 2022 crop marketing year are projected to be 12.0 million bales.

To date (as of the week ending Feb. 2), total sales are 10.14 million bales and shipments 5.03 million bales. With a little over 25 reporting weeks remaining in the marketing year, shipments must average 276,000 bales/week to meet the USDA projection.
Over the past six weeks, shipments have averaged 181,500 bales per week. Shipments were over 200,000 bales in just two of those six weeks. At this pace, exports would not reach the 12 million bale projection, and stocks going into the 2023 crop year would increase.
2023 Planting. The U.S. planted 13.76 million acres last year compared to 11.22 million in 2021 and 12.09 million in 2020. It is already widely expected that acreage will decline in 2023, perhaps significantly. The lowest acreage we’ve seen in recent years was 10.07 million acres in 2016 and 8.58 million in 2015.
NOTE: The National Cotton Council survey of 2023 planting intentions was released on Feb. 12, showing 11.42 million acres expected for 2023 – a decline of 17%. This acreage is higher than many expectations.
We know that acres harvested is the more crucial factor. Over the past five years, harvest has averaged 74% of acres planted or abandonment of 26%. Yield has been an average of 866 lbs./acre.
The 2022 U.S. crop was 14.68 million bales. Assuming average yield and abandonment, planting of 11 million acres (a reduction of 20%) would still produce a crop equal to 2022.
An Example Net Returns Comparison. These are University of Georgia estimates.
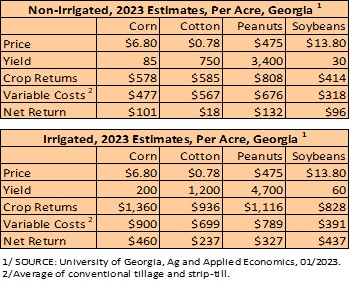
The price used for cotton is well below current December futures. At that price, cotton would not compare favorably to other crops. Using these estimates, cash cotton needs to be 86 to 96 cents (basis December futures) to equal net returns. December is currently around 85 cents.